HECTOR programme | Field documentation
Monitoring Technology & Field Evidence
A closer look at equipment installations, water collection and the different types of evidence used in project reporting.
MONITORING IN THE PROJECT REPORTS
How treatment and digital monitoring work
The VPA1 and VPA2 monitoring reports describe a system combining water treatment, connected instruments and cloud-based analytics. The explanation below follows those reports and their reporting periods.
Automated chlorination and UV disinfection
The VPA2 report describes sodium hypochlorite dosing based on water volume during the tank-filling cycle, with UV as a secondary disinfection stage. It also describes tank-level monitoring and automatic filling. Treatment equipment and monitoring instruments perform different roles: treatment acts on the water, while monitoring provides information about water conditions and system operation.
Source: VPA2 monitoring report, p. 5 and section B.1.
From field readings to reviewable information
1. Collect field data
Connected instruments collect water-quality and operational inputs. The reports describe physical measurements such as pH, temperature, electrical conductivity, dissolved oxygen, turbidity and oxidation-reduction potential.
2. Process in the cloud
IoT communication sends inputs for cloud processing. AI/ML models use selected inputs to estimate additional parameters through virtual sensors. The VPA1 report describes laboratory data used for offline training and periodic validation, separately from real-time inference.
3. Review and respond
Web and app interfaces make results available for monitoring. The VPA1 report describes automated checks, staff review and event records so unusual readings can be investigated and operational issues followed up.
Sources: VPA1 monitoring report, pp. 26-33; VPA2 monitoring report, pp. 13-16.
Physical measurements and virtual sensor estimates
The VPA2 equipment specifications distinguish physical instruments from AI-driven virtual sensors. This distinction helps explain what a displayed result represents.
Physical instruments
The report lists instruments for pH/ORP, dissolved oxygen, electrical conductivity/TDS and turbidity/TSS, alongside temperature sensing. These provide instrument-based inputs.
AI-driven virtual sensors
The same specifications describe E. coli and coliforms, fluoride and residual chlorine as virtual sensor outputs. These are model-derived estimates and should be read separately from direct instrument readings or laboratory test results.
Source: VPA2 monitoring report, pp. 14-16. The lists describe the report’s equipment specifications, rather than a site-by-site installation inventory.
How data quality is checked
The VPA1 report describes a combination of automated checks and human review:
- Flag unusual readings. Range, plausibility and rate-of-change checks help identify results that need investigation.
- Keep an audit trail. Abnormal or zero readings are retained with status flags while staff compare operational telemetry, readings over time and relevant laboratory results.
- Preserve reporting boundaries. The report describes model-version records, frozen reporting snapshots and links to site IDs and timestamps for emission-reduction reporting.
It also describes escalation to the responsible government water officials for operational action. Monitoring alerts do not themselves mean that the system automatically shuts down the water supply.
Source: VPA1 monitoring report, pp. 31-33.
Explore the supporting reports
VPA1 official monitoring documents (new tab)
Monitoring period: 1 February 2025 – 28 October 2025.
VPA2 official monitoring documents (new tab)
Monitoring period: 2 June 2025 – 31 December 2025.
This summary describes the documented monitoring approach. Monitoring records, laboratory evidence and certification decisions are separate sources of evidence. For credit calculation assumptions, see Methodology & Baseline.
DOCUMENTED INSTALLATIONS
Installation timeline and reporting coverage
The monitoring reports describe installations in Anantapur district, Andhra Pradesh, India. Installation dates and monitoring periods answer different questions: when equipment was installed, and which period a report covers.
VPA1 / GS13130
May 2024 installations
The installation table lists 45 site/device records dated 17-31 May 2024. The reviewed period 2 report covers 1 February – 28 October 2025.
VPA2 / GS23337
26 villages in the 2025 period
The report states that its 2 June – 31 December 2025 monitoring period covers 26 villages. Its first 26 installation records are dated 2-5 June 2025.
VPA2 / SUBSEQUENT INSTALLATIONS
January 2026 additions
The same table lists a further 19 site records dated 24-28 January 2026, making 45 entries overall. These later installations fall outside the report’s 2025 monitoring period.
Sources: VPA1 report, pp. 2 and 11-12; VPA2 report, pp. 2 and 9-11. Counts refer to the specified report and period, not a live programme-wide total.
VPA1 / GS13130 – 45 installation records
Site names and dates follow the report’s installation table. Each row is a site/device record; repeated village names can identify separate installations. These historical records do not indicate current device status.
| No. | Site / device name | Installation date |
|---|---|---|
| 1 | ATP-Mukundapuram | 17 May 2024 |
| 2 | ATP-Honnur-40 | 31 May 2024 |
| 3 | ATP-Kallumadi-40 | 18 May 2024 |
| 4 | ATP-Dhantalapalli | 30 May 2024 |
| 5 | ATP-Palyam | 18 May 2024 |
| 6 | ATP-Kottalapali-60 | 21 May 2024 |
| 7 | ATP-Velpumadugu | 23 May 2024 |
| 8 | ATP-Bukkapuram | 28 May 2024 |
| 9 | ATP-Honnur-60 | 31 May 2024 |
| 10 | ATP-Marthadu | 18 May 2024 |
| 11 | ATP-Kadvakallu | 20 May 2024 |
| 12 | ATP-Kalluhola | 31 May 2024 |
| 13 | ATP-Vemulapalli | 30 May 2024 |
| 14 | ATP-C-Vengannapalli | 30 May 2024 |
| 15 | ATP-Parasannaypalle-40K A | 24 May 2024 |
| 16 | ATP-Parasannaypalle-40K B | 24 May 2024 |
| 17 | ATP-Maddalapalli | 19 May 2024 |
| 18 | ATP-Maddipalli | 20 May 2024 |
| 19 | ATP-Bodiganidoddi | 19 May 2024 |
| 20 | ATP-Nemakallu | 31 May 2024 |
| 21 | ATP-Vankarajukalva | 18 May 2024 |
| 22 | ATP-S-Gudur | 30 May 2024 |
| 23 | ATP-Singavaram | 20 May 2024 |
| 24 | ATP-Yerraguntla | 17 May 2024 |
| 25 | ATP-Raptadu-40K | 22 May 2024 |
| 26 | ATP-Raptadu-100K | 23 May 2024 |
| 27 | ATP-Thumpera | 19 May 2024 |
| 28 | ATP-W-Narsapuram | 18 May 2024 |
| 29 | ATP-Uddehal-40 | 30 May 2024 |
| 30 | ATP-Uddehal-90 | 31 May 2024 |
| 31 | ATP-Kallumadi-120 | 18 May 2024 |
| 32 | ATP-E-Narasapuram | 18 May 2024 |
| 33 | ATP-Yellanur-120K | 29 May 2024 |
| 34 | ATP-Yellanur-90K | 29 May 2024 |
| 35 | ATP-Sodanapalli | 19 May 2024 |
| 36 | ATP-Gadakal | 22 May 2024 |
| 37 | ATP-Garladinne-40K | 17 May 2024 |
| 38 | ATP-Garladinne-60K | 17 May 2024 |
| 39 | ATP-Sreedaragatta | 30 May 2024 |
| 40 | ATP-Thimmapeta | 17 May 2024 |
| 41 | ATP-Kottalapali | 17 May 2024 |
| 42 | ATP-Komatikuntla | 30 May 2024 |
| 43 | ATP-Illuru | 18 May 2024 |
| 44 | ATP -Rudrampeta | 25 May 2024 |
| 45 | ATP – Rajiv Colony | 25 May 2024 |
Source: VPA1 / GS13130 monitoring report, section B.1, pp. 11-12.
VPA2 / GS23337 – 45 installation records
Site names and dates follow the report’s installation table. Each row is a site/device record; repeated village names can identify separate installations. These historical records do not indicate current device status.
| No. | Site / device name | Installation date |
|---|---|---|
| 1 | ATP-KANDUKUR | 2 June 2025 |
| 2 | ATP-RACHANAPALLE | 2 June 2025 |
| 3 | ATP-THALUPURU | 2 June 2025 |
| 4 | ATP-ATMAKUR | 2 June 2025 |
| 5 | ATP-GORIDINDLA | 2 June 2025 |
| 6 | ATP-P. YALERU | 2 June 2025 |
| 7 | ATP-SANAPA | 2 June 2025 |
| 8 | ATP-UNTHAKAL | 4 June 2025 |
| 9 | ATP-BOMMANAHAL | 4 June 2025 |
| 10 | ATP-BOLLANAGUDAM | 4 June 2025 |
| 11 | ATP-SINGANAHALLI | 4 June 2025 |
| 12 | ATP-K.K. AGRAHARAM | 2 June 2025 |
| 13 | ATP-PODARALLA | 2 June 2025 |
| 14 | ATP-D.HIREHAL | 4 June 2025 |
| 15 | ATP-Kalluru Agraham | 4 June 2025 |
| 16 | ATP-KRISHNAPURAM | 4 June 2025 |
| 17 | ATP-KOTANKA | 4 June 2025 |
| 18 | ATP-KASAPURAM | 5 June 2025 |
| 19 | ATP-KAMBADUR | 5 June 2025 |
| 20 | ATP-NUTHIMADUGU | 5 June 2025 |
| 21 | ATP-YERRAGUNTA | 5 June 2025 |
| 22 | ATP-HANAKANAHAL | 5 June 2025 |
| 23 | ATP-KUDAIR | 3 June 2025 |
| 24 | ATP-THIMMAPURAM | 3 June 2025 |
| 25 | ATP-IPPERU | 3 June 2025 |
| 26 | ATP-VENKATAMPALLE | 3 June 2025 |
| 27 | BELUGUPPA | 28 January 2026 |
| 28 | ANKAMPALLE | 24 January 2026 |
| 29 | GANGAVARAM | 24 January 2026 |
| 30 | CHAMALURU | 24 January 2026 |
| 31 | PEDDAPAPPUR | 25 January 2026 |
| 32 | JUTUR | 25 January 2026 |
| 33 | MUCHUKOTA | 25 January 2026 |
| 34 | BANDAMEEDAPALLE | 26 January 2026 |
| 35 | CHINNAPOLAMADA | 26 January 2026 |
| 36 | PEDDAPOLAMADA | 26 January 2026 |
| 37 | MOPIDI | 26 January 2026 |
| 38 | MARURU | 26 January 2026 |
| 39 | NERIMETLA | 26 January 2026 |
| 40 | CHABALA | 27 January 2026 |
| 41 | GULAPALEM | 27 January 2026 |
| 42 | CHANDANA | 27 January 2026 |
| 43 | RAYALACHERUVU | 27 January 2026 |
| 44 | NITTURU | 28 January 2026 |
| 45 | KOWKUNTLA | 28 January 2026 |
Source: VPA2 / GS23337 monitoring report, section B.1, pp. 10-11.
REPORTED HOUSEHOLD COVERAGE
VPA1 households in the reporting period
VPA1 / GS13130 · MONITORING PERIOD 2
39,470 households reported
The VPA1 monitoring report records 39,470 households served for 1 February – 28 October 2025. It attributes the household total to village administrative letters received between January and August 2025, supported by the project survey and village population database.
This is the report’s household figure for that period, rather than a survey sample size or a current programme-wide total. It is separate from the report’s site/device installation records.
Source: VPA1 monitoring report, SDWS 26, p. 56; SDG 6, p. 60. Open the official VPA1 monitoring documents.
DOCUMENTED VERIFICATION VISIT
VPA1 field inspection and interviews
VPA1 / GS13130 · MONITORING PERIOD 2
On-site audit: 17-21 February 2026
The VPA1 verification report identifies SustainCERT S.A. as the validation and verification body. Its on-site inspection took place after the monitored period of 1 February – 28 October 2025.
The report describes inspection at selected project locations, covering Tank365 units, chlorination and UV equipment, connected monitoring sensors and water-storage infrastructure. The team also reviewed monitoring outputs, data capture and transmission, quality-control procedures, and interviews with project personnel and local stakeholders.
Locations named in the interview records
The report’s end-user interview table names the following locations in Anantapur district, Andhra Pradesh, India. Dates below are interview dates, rather than installation dates.
- Illuru: 18 February 2026.
- East Narsapuram: 20 February 2026.
- Sodanapalli: 20 February 2026.
- Bodiganidoddi (Rotary Puram): 20 February 2026.
- Garladinne: 20 February 2026.
- Thimmampeta: 21 February 2026.
Source: verification report, section D.4, pp. 12-16. These are locations named in the end-user interview table, not a complete inventory of inspected tanks or a mapping of the photographs below.
What the verification report concludes
Section D.5 records 31 end-user interview samples and a reasonable level of assurance. Section G gives SustainCERT S.A.’s opinion that the project meets the relevant Gold Standard requirements applicable to that monitoring period. The review combined inspection, interviews, monitoring records, calculation files and other supporting evidence.
The verification opinion concerns the specified reporting period. It does not establish current operating status at every installation or, by itself, a subsequent credit issuance. Issuance and retirement records are listed separately in the project evidence hub.
Source: GS13130_MP2_VER_Report_17062026_clean_SgACM.pdf, report version 2, completed 11 June 2026; p. 1, sections D.3-D.5, pp. 11-16, and section G, pp. 39-40. Open the official VPA1 document list.
DOCUMENTED VERIFICATION VISIT
VPA2 field inspection and interviews
VPA2 / GS23337 · MONITORING PERIOD 1
On-site audit: 17-21 February 2026
The VPA2 verification report identifies SustainCERT S.A. as the validation and verification body and records an on-site audit on 17-21 February 2026. The monitoring period reviewed was 2 June – 31 December 2025.
Sections D.2-D.4 describe review of treatment equipment, connected monitoring instruments, water-storage infrastructure, monitoring outputs and quality-control procedures, alongside interviews with project personnel and stakeholders.
Locations identified as VPA2 in the interview table
- K.K Agraharam: 18 February 2026.
- Venkatampalli: 18 February 2026.
- Ipperu: 19 February 2026.
- Thimmapuram (Karutlapalli): 19 February 2026.
- P Yaleru: 19 February 2026.
- Talupur: 19 February 2026.
- Kasapuram: 21 February 2026.
Source: section D.4, pp. 12-15. The table also contains baseline-survey and laboratory interviews, which are separate from these VPA2-labelled locations. These are interview dates, not installation dates or a statement that each location was operating throughout the 2025 monitoring period.
Verification opinion and reporting scope
Section G gives SustainCERT S.A.’s opinion that the project meets the relevant Gold Standard requirements applicable to the specified monitoring period. The report describes reasonable assurance supported by document review, monitoring data, calculation files and other evidence.
The visit records are separate from the report’s monitoring-period coverage and subsequent credit issuance. They do not identify which photographs below were taken during the audit.
Source: GS23337_MP1_VER_Report_Clean_SgACM.pdf, report version 02, completed 21 August 2026; p. 1, sections D.2-D.5, pp. 10-16, and section G, pp. 35-36. Open the official VPA2 document list.
Community feedback and grievance records
Section G of both monitoring reports describes a formal grievance mechanism for community feedback about water access, quality and infrastructure.
- Local contact and awareness. The reports describe liaison with village leaders, community meetings and awareness sessions explaining how people can raise concerns.
- Recording and follow-up. A grievance book and digital records support the tracking of concerns and responses. The reports describe feedback records, including images and voice notes, held in a central system.
- Period-specific outcomes. Both reports state that no grievances were received during their respective monitoring periods: 1 February – 28 October 2025 for VPA1, and 2 June – 31 December 2025 for VPA2.
The grievance summary describes the reports’ recorded feedback process and outcomes. It does not establish that no concerns arose outside those periods or replace the underlying consultation records.
Sources: VPA1 report, section G, pp. 77-78; VPA2 report, section G, pp. 78-79. Open the VPA1 official documents or VPA2 official documents for the full reports.
Reading field evidence
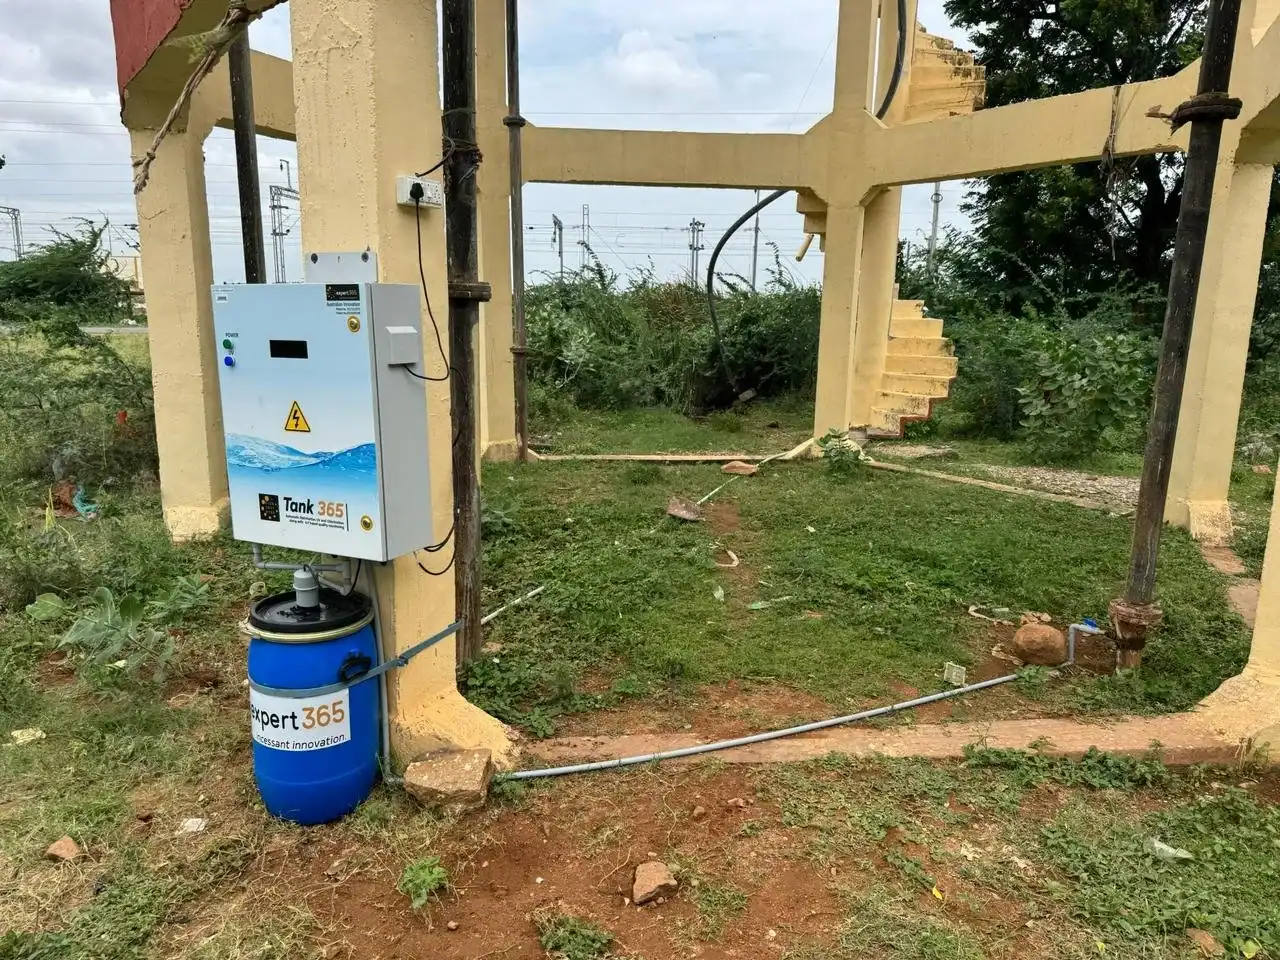
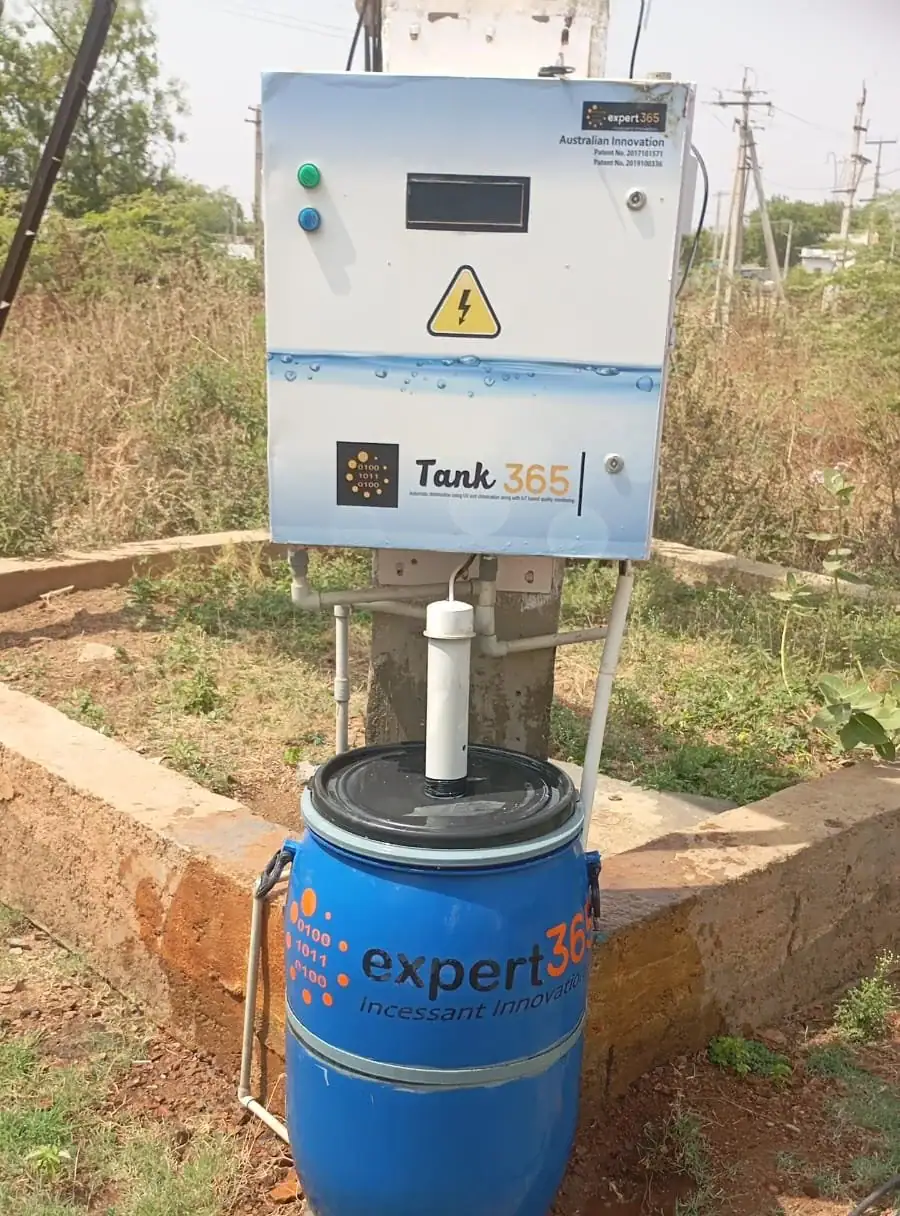
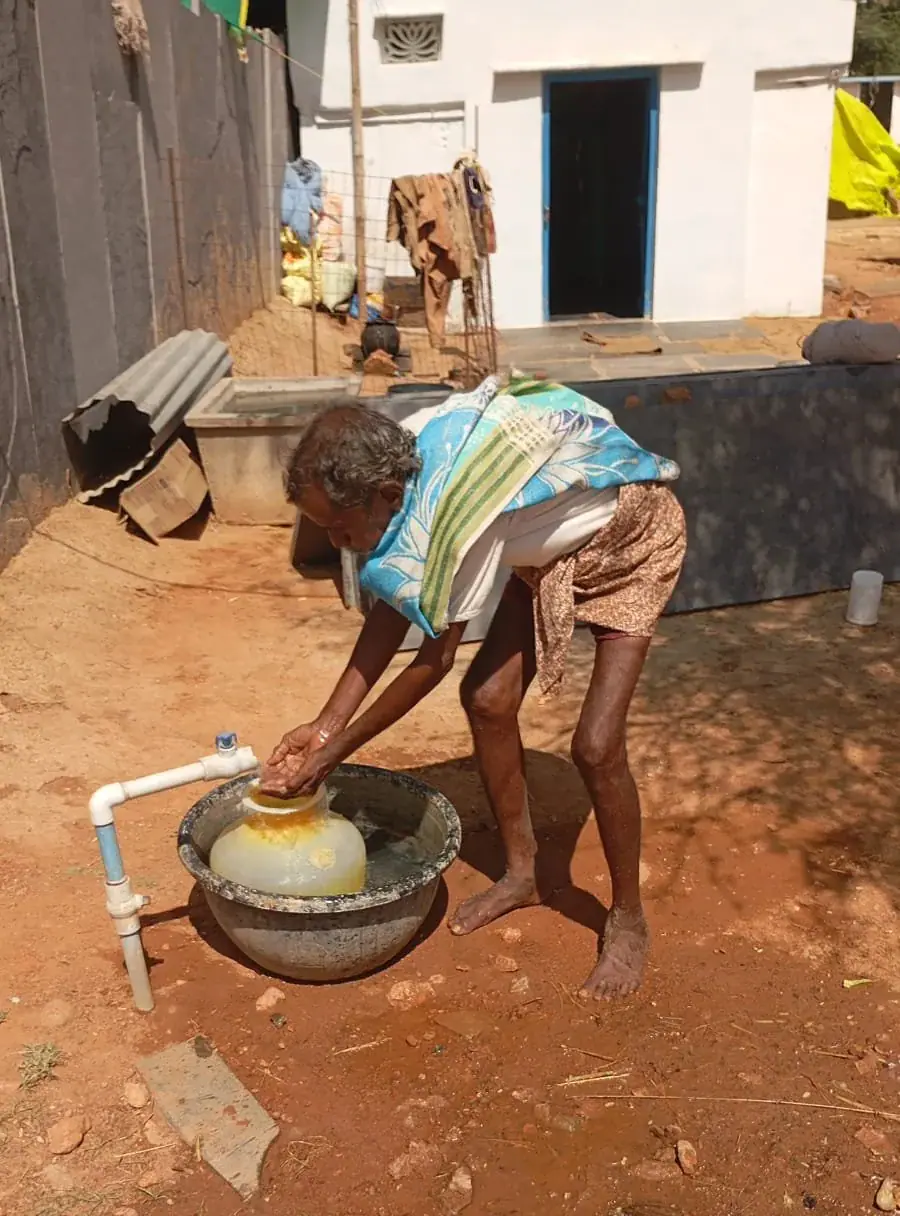
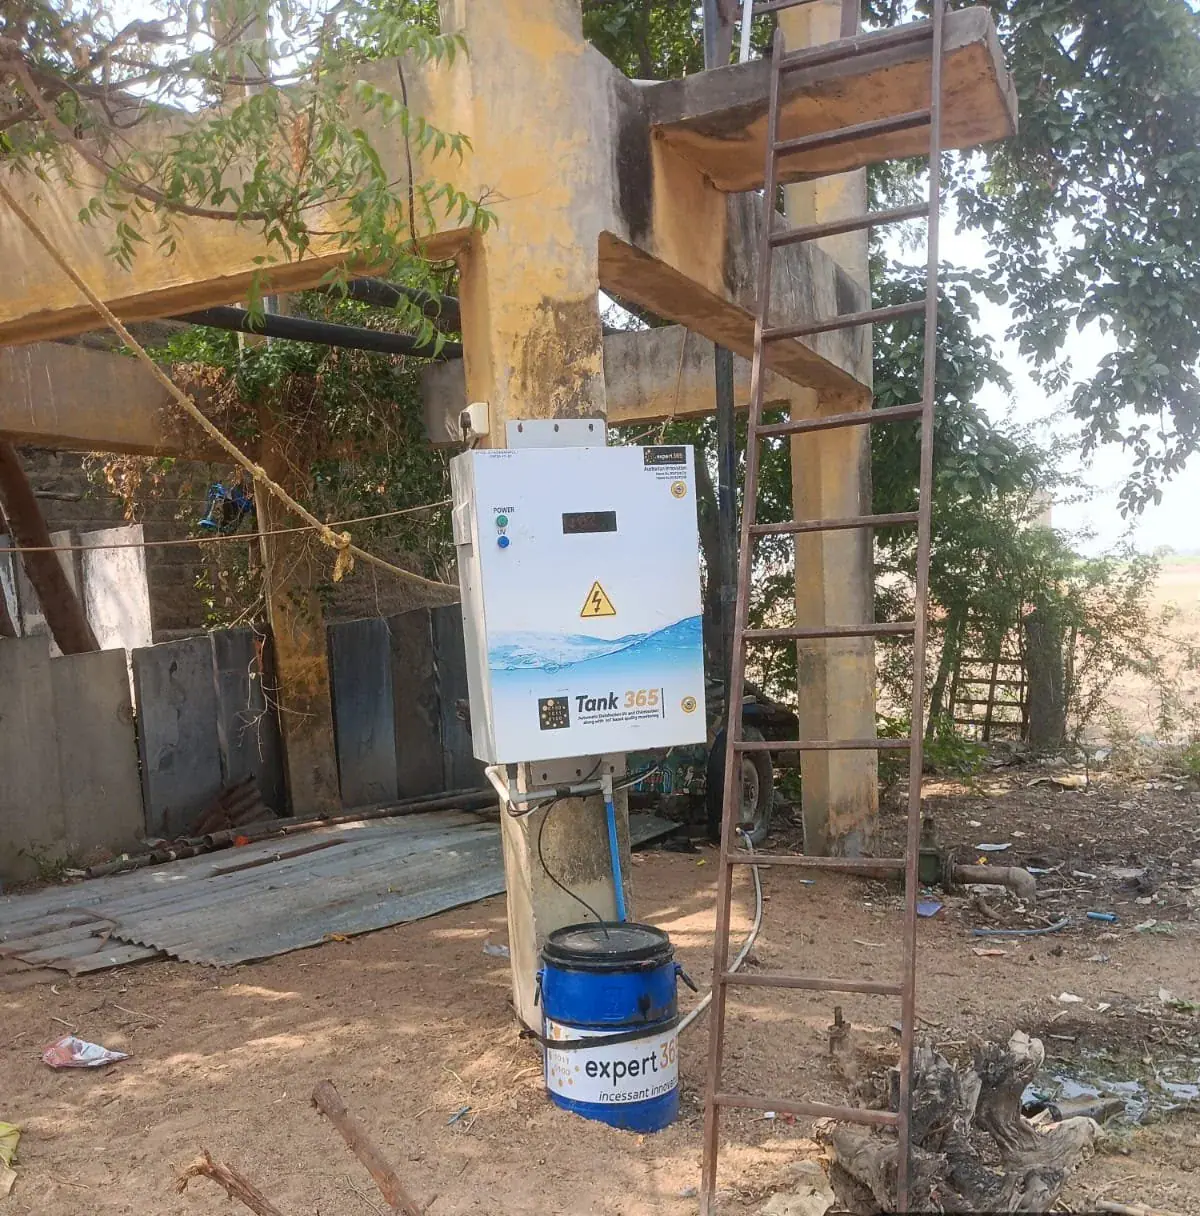
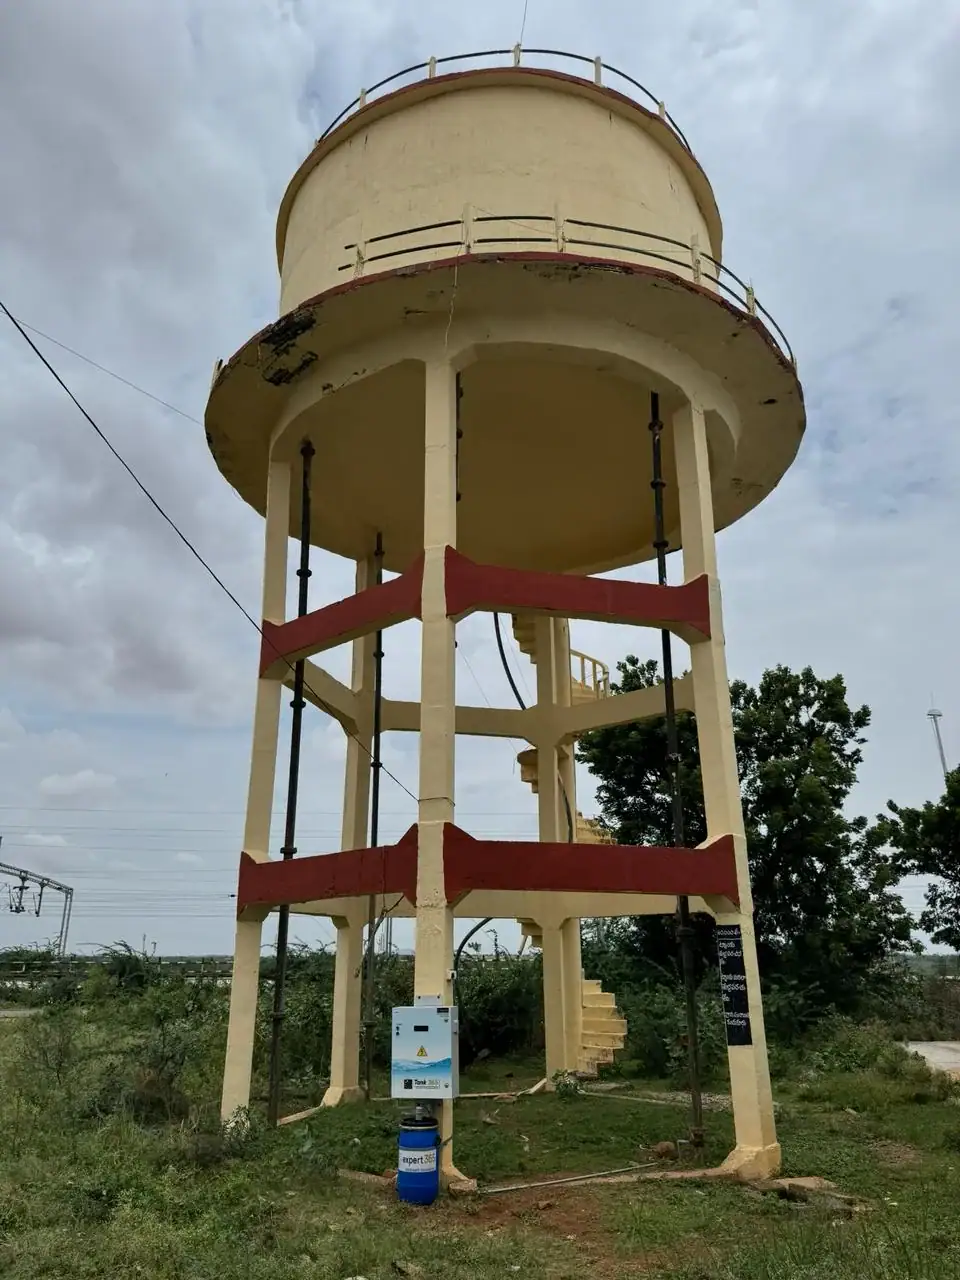
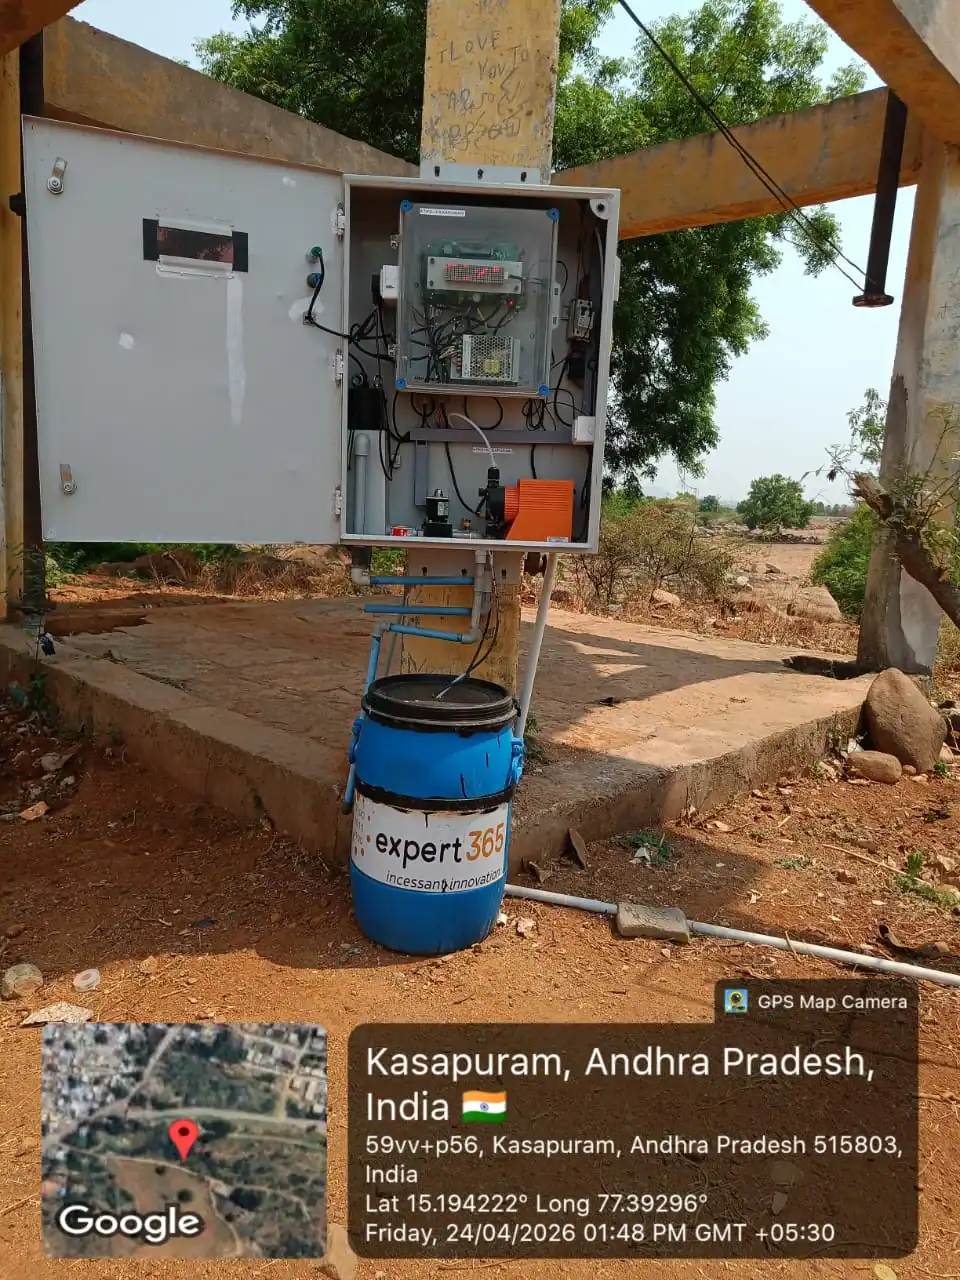
Installation photographs provide context for equipment and water collection. Water-quality measurements, modelled estimates and certification records are different types of evidence; photographs alone do not establish treatment performance or carbon-credit certification.
FIELD PHOTOGRAPHS
Installation context & water collection
Explore equipment installations and water collection in the photographs below. Select a photograph to open the larger image.
Project evidence & official records · Methodology & baseline
 +918008529761

